HistogramInterpolationPolynomial
-
MLModule
Purpose
The module HistogramInterpolationPolynomial computes (an approximation to) a histogram of a multivariate, scalar interpolation polynomial.
Tips
If you are somehow unsatisfied with this module, try also the module Histogram3DInterpolationPolynomial, which uses a different algorithm (i.e. different approximation to the histogram) and also allows histograms for 3D valued functions.
Parameter Fields
Field Index
Apply: Trigger |
Integral: Double |
Simplify polynomial: Bool |
Auto apply: Bool |
Interval Probabilities: String |
Use manual bounding box: Bool |
Automatic Bounding Box: String |
Intervals: String |
Use manual min and max values: Bool |
Automatic Max Value: Double |
Manual Bounding Box: String |
|
Automatic Min Value: Double |
Manual Max Value: Double |
|
Capture constant polynomials: Bool |
Manual Min Value: Double |
|
Epsilon to Avoid Division by Zero: Double |
Normalize: Bool |
|
Histogram Accuracy: Integer |
Number of Histogram Points: Integer |
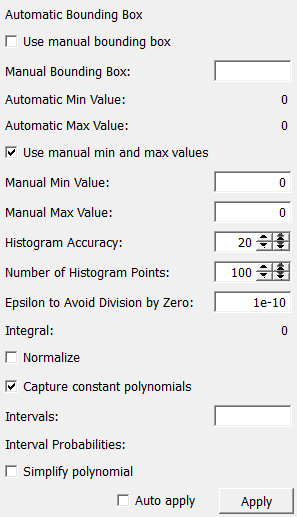
Visible Fields
Automatic Bounding Box
-
name:autoBBox, type:String, persistent:no¶ Shows the generic bounding box of the polynomial.
It can also be obtained with an
EvaluateInterpolationPolynomialmodule.
Use manual bounding box
-
name:useManBBox, type:Bool, default:FALSE¶ If checked, the manually set bounding box is used.
The module needs a bounding box. This is a cuboid in the multidimensional pre-image space (German: Urbildraum).
The polynomial is restricted to this set before the histogram is computed. Since this set is compact, the range of the polynomial will then also be compact, hence bounded. This field determines whether the automatic (generic) bounding box of the polynomial is used for this purpose or a manual bounding box can be entered.
Automatic Min Value
-
name:autoMin, type:Double, persistent:no¶ Shows the automatically computes minimum value that the polynomial takes on the selected bounding box.
Automatic Max Value
-
name:autoMax, type:Double, persistent:no¶ Shows the automatically computes maximum value that the polynomial takes on the selected bounding box.Shows the maximum of the automatic bounding box.
Use manual min and max values
-
name:useManMinMax, type:Bool, default:TRUE¶ If checked, the module uses the manually set min/max values.
The module needs min and max values that define an interval in the one-dimensional image space (German: Bildraum). It is sensible to use the minimal and maximal function values of the polynomial within the specified bounding box. If the interval is chosen larger, the histogram will be zero outside this interval. If it is chosen smaller, the histogram is cut to this interval, and the integral of the histogram will not be 1 anymore.
This field determines whether the automatically determined min and max values are used or manual min and max values can be entered.
However, note that switching this field off can reduce the performance considerably. If the range of you polynomial is fixed anyway, you should switch this field on and enter the correct min and max values manually.
Histogram Accuracy
-
name:accuracy, type:Integer, default:20, minimum:2¶ Sets the number of points per space dimension in which the bounding box is scanned.
The higher the number, the better is the approximation of the histogram.
Number of Histogram Points
-
name:numPoints, type:Integer, default:100, minimum:2¶ Sets the number of points in which the interval in image space is scanned.
The higher the number, the better is the approximation of the histogram.
Epsilon to Avoid Division by Zero
-
name:eps, type:Double, default:1e-10, minimum:0¶ Sets an epsilon value to avoid a division by zero.
In the computation procedure, some divisions have to be performed where the denominator might be zero. This corresponds to the fact that a histogram can have infinitely high peaks. To avoid problems, the (small) value entered in this field is added to the denominator before the division.
The smaller the number, the better is the approximation of the histogram. 0 is allowed but not recommended, except possibly if you are sure that the polynomial has no critical points within the specified bounding box.
Simplify polynomial
-
name:simplifyPolynomial, type:Bool, default:FALSE¶ If checked, the polynomial will be simplified first.
This is using the same procedure as the
SimplifyInterpolationPolynomialmodule.This may either speed up or slow down the computation, depending on the polynomial and on the settings.
Note that simplifying a polynomial destroys the bounding box information, but that does not matter since this module evaluates the bounding box before simplifying.
Integral
-
name:integral, type:Double, persistent:no¶ Shows the integral of the computed approximation of the PDF.
A value that is far away from 1 indicates that the result is a bad approximation and the value in the
Histogram Accuracyfield should be increased.
Normalize
-
name:normalize, type:Bool, default:FALSE¶ If checked, both the curve and the compute interval probabilities are divided by the computed integral.
This should be used with care since an integral that is far away from 1 indicates that the accuracy should be increased. On the other hand, for integral values slightly below 1 (like e.g. 0.98), this might be a useful option if interval probabilities are computed and it is required that complementing interval probabilities sum up to 1.
Capture constant polynomials
-
name:specialConst, type:Bool, default:TRUE¶ If checked, the module treats a constant polynomial specially in that way that at least the interval probabilities are displayed correctly (that is 0 or 1, depending on whether the constant value is inside or not).
The underlying algorithm is not able to naturally work correctly with constant polynomials. In this case, the normal behavior is that the curve, the interval probabilities, and the integral value are all 0. (If Normalize is enabled, this causes a division by zero.)
The curve is not influenced by this, because a Dirac curve cannot be represented in the current data structure anyway. The integral value is not influenced by this either, because there is no additional information of this.
Note that it can happen (though it is unlikely) that a constant polynomial is not recognized as being constant. In this case, this switch naturally does not work. You might want to enable
Simplify polynomialto avoid this problem.
Intervals
-
name:intervals, type:String¶ Sets a list of unions of intervals.
As an additional feature of this module, you may enter here a list of unions of intervals, and the module will compute (an approximation to) the probabilities that the polynomial’s value lies in these unions of intervals. These probabilities will be displayed in the Interval Probabilities field.
The syntax can most easily be described by an example. Consider, you want to know the probability that the polynomial’s value is between 3 and 4, and also you want to know the probability that it is either between 5 and 6 or between 7 and 8. Then, you enter 3,4;5,6,7,8. The computation is performed on the fly, i.e. with nearly no extra computational effort.