CurveFilter
- MLModule
genre
authors
package
dll
definition
see also
CurveGenerator,SoDiagram2D,BaseBypassOp,CurveProperties,CurveListConvert,CurveInfokeywords
curve,diagram,filter,base,parser,differentiate,integrate,smooth,median,average,min,max,quantile,histogram,DVH,dose,volume,histogram,resample
Purpose
The module CurveFilter filters an input Curve by some criteria and generates a filtered copy as output.
Usage
Connect a plain Curve or CurveList to the input and select a filter mode. Use CurveListConvert to get alternative Curve data in a suitable format.
Windows
Default Panel
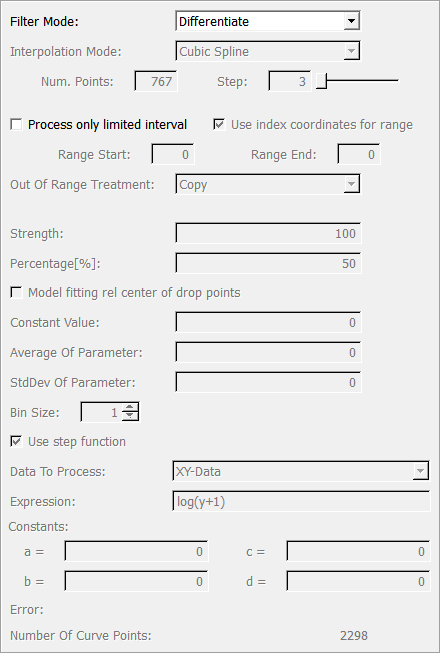
Input Fields
inCurves
- name: inCurves, type: MLBase
The input defines the input curve(s).
Use
CurveGeneratorand affiliated modules like ConcatenateCurve,CurveInfo, etc. for input.
Output Fields
outCurves
- name: outCurves, type: MLBase
Filtered result curve(s).
Parameter Fields
Field Index
|
|
|
|
|
|
|
|
|
|
|
|
|
|
|
|
|
|
|
|
|
|
|
|
|
|
|
Visible Fields
Debug Level
- name: debugLevel, type: Integer, default: 0
Controls the verbosity of the module. Values > 0 will result in possibly many console output lines. Intended for debugging only.
Filter Mode
- name: filterMode, type: Enum, default: Off
Defines the filter operation.
Values:
Title |
Name |
Description |
|---|---|---|
Off |
Off |
Forwards a copy of the curve |
Math. expression |
Math. expression |
Enter your own expression for filtering |
Smooth |
Smooth |
Smoothing by using a moving average in a window of size 2 * (CAVE this uses index number not world coordinates to determine the window width) |
Differentiate |
Differentiate |
Numerical differentiation (compute quotient of differences) |
Integrate |
Integrate |
Numerical integration (simple numerical integarion) |
Average |
Average |
Compute flat curve at average. The average value for the first curve is written to field constCurveParam. Hint: Similarly other constant values for a curve will be written to that field for some modes resulting in one value per curve. |
Std Dev |
StdDev |
Compute flat curve at average |
Median |
Median |
Compute local median (for a flat curve at median value use quantile with parameter 50%) |
Resample |
Resample |
Does a crude resampling of the x range (CAVE: X Range may change due to resampling !) |
Max |
Max |
Compute flat curve at max |
Min |
Min |
Compute flat curve at min |
Quantile |
Quantile |
Compute stated quantile of curve values. Constant curve at quantile parameter (stated in %) |
Cumulated Histogram |
CumulatedHistogram |
Compute cumulated histogram curve (= integral normalized to 100%) |
Inverse Cum Histogram |
InverseCumHistogram |
Compute inverse cumulated histogram curve (= 100% - integral normalized to 100%) (mode for things like dose-volume-histograms (DVH)) |
Max Pos |
MaxPos |
Curve values: (max-min) x delta( . - maxPos) Peak at leftmost maximum position. Position of max written to constCurveParam |
Mean Pos |
MeanPos |
max - (max- min) x heavyside(. - meanPos) Change near mean position (X-grid points left of mean at max, above mean+1 at min, @ meanInx & meanIdx+1 at average (min,max)) Mean written to constCurveParam |
Lower Drop Point |
LowerDropPoint |
Position below peak were value first falls below percentage of max value |
Upper Drop Point |
UpperDropPoint |
Position above peak were value first falls below percentage of max value |
Center Of Drop Points |
CenterOfDropPoints |
Middle position of the two drop points |
Width At Drop Points |
WidthAtDropPoints |
Distance of the two drop points |
Normalized Integral Curve |
NormalizedIntegralCurve |
Computes normalized curve whose Integral is 1 |
Normalized Height Curve |
NormalizedHeightCurve |
Computes normalized curve whose maximum height is 1 |
Hist Average |
HistAverage |
Assumes curve is a histogram and computes expected value / mean |
Hist Std Dev |
HistStdDev |
Assumes curve is a histogram and computes std dev ( 1/N version) |
Curvature |
Curvature |
Curvature = 1/ radius of circle fitted through each point and its neighbours (at distance selected by _fldSmoothStrength) |
Histogram Bins |
HistogramBins |
Assumes curve is a histogram and re-samples it according to a given bin size |
Zero Of Lower Tangent |
ZeroOfLowerTangent |
Find zero of approximate tangent defined as secant between lower drop point at percentage p and drop point at level p + (100%-p)/2 |
Zero Of Upper Tangent |
ZeroOfUpperTangent |
Find zero of approximate tangent defined as secant between upper drop point at percentage p and drop point at level p + (100%-p)/2 |
Zero Of Lower Secant |
ZeroOfLowerSecant |
Find zero of secant between lower drop point at percentage p and peak or center from drop points at level p |
Zero Of Upper Secant |
ZeroOfUpperSecant |
Find zero of secant between upper drop point at percentage p and peak or center from drop points at level p |
Lower Next Local Min |
LowerNextLocalMin |
Next local min left of peak with value below stated percentage of peak |
Upper Next Local Min |
UpperNextLocalMin |
Next local min right of peak with value below stated percentage of peak |
Zero Of Lower Parabola Fit |
ZeroOfLowerParabolaFit |
Find zero of parabola fit between lower drop point at percentage p and peak or center from drop points at level p |
Zero Of Upper Parabola Fit |
ZeroOfUpperParabolaFit |
Find zero of parabola fit between upper drop point at percentage p and peak or center from drop points at level p |
Count Non Zero Points |
CountNonZeroPoints |
Used e.g. to counts spikes in a histogram of upscaled integer images to revert the scaling |
Max Non Zero Point |
MaxNonZeroPoint |
Used e.g. find range in a histogram |
Min Non Zero Point |
MinNonZeroPoint |
Used e.g. find range in a histogram |
Center Of Non Zero Range |
CenterOfNonZeroRange |
Used e.g. find center of range in a histogram |
Width Of Non Zero Range |
WidthOfNonZeroRange |
Used e.g. find width of range in a histogram |
Subtract Baseline |
SubtractBaseline |
Interpolation Mode
- name: interpolationMode, type: Enum, default: CubicSpline
Defines the interpolation mode if the
Filter Modeis Resample.
Values:
Title |
Name |
|---|---|
Constant |
Constant |
Linear |
Linear |
Quadratic |
Quadratic |
Cubic Spline |
CubicSpline |
Pw Cubic Hemite |
PwCubicHemite |
Centered Cubic |
CenteredCubic |
Process only limited interval
- name: onlyProcessSubRange, type: Bool, default: FALSE, deprecated name: onlyProcessMarkedInterval
If checked, only a specific interval of the selected curves are filtered.
Out Of Range Treatment
- name: outOfRangeTreatment, type: Enum, default: Copy
Describe what values will be filled outside of startIndex and endIndex when processing a limited range of the curve data.
Values:
Title |
Name |
Description |
|---|---|---|
Copy |
Copy |
Default behaviour: just copy original curve values (for legacy reasons) |
Fill Zeros |
FillZeros |
Might become future standard behavior |
Fill Curve Min |
FillCurveMin |
Alternative std behavior ? |
Fill Curve Max |
FillCurveMax |
Special purpose mode |
Fill Const Curve Value |
FillConstCurveValue |
Could be reasonable choice for certain modes |
Fill Range End Values |
FillRangeEndValues |
Most resonable choice for certain modes, e.g. integral |
Range Start
- name: rangeStart, type: Double, default: 0, deprecated name: markerStart
Sets the start index of the interval of curves to be filtered.
Range End
- name: rangeEnd, type: Double, default: 0, deprecated name: markerEnd
Sets the end index of the interval of curves to be filtered.
Use index coordinates for range
- name: rangeInIndexCoordinates, type: Bool, default: TRUE
If checked the range will be specified in curve index values instead of X axis coordinates (legacy mode, this is the way these parameters were interpreted in the first implementation).
Number Of Curve Points
- name: numberOfCurvePoints, type: Integer, persistent: no
Provides number of grid positions as basic curve info.
Expression
- name: parserExpression, type: String, default: x^2+2*x
Sets a mathematical expression for the
Filter ModeMath. expression.
Data To Process
- name: parserData, type: Enum, default: Y-Data
Defines in which dimension the data should be processed.
Values:
Title |
Name |
Description |
|---|---|---|
X-Data |
X-Data |
Apply formula to parameter x |
Y-Data |
Y-Data |
Apply formula to parameter y |
XY-Data |
XY-Data |
Apply formula to parameter x and y |
Error
- name: parserErrorText, type: String
Shows an error message of the function parser.
a =
- name: parserExtValueA, type: Double, default: 0
Sets one of four variables for use in the expression.
b =
- name: parserExtValueB, type: Double, default: 0
Sets one of four variables for use in the expression.
c =
- name: parserExtValueC, type: Double, default: 0
Sets one of four variables for use in the expression.
d =
- name: parserExtValueD, type: Double, default: 0
Sets one of four variables for use in the expression.
Strength
- name: smoothingStrength, type: Double, default: 10
Smoothing over that many curve points / distance (in # points). Also distance to take secants in curvature mode. (CAVE: This parameter is not then smoothing window width in X range, if x step != 1)
Num. Points
- name: numResamplePoints, type: Integer, default: 10
Sets the number of target re-sample points.
Step
- name: resampleInterval, type: Double, default: 1
Sets the step width for re-sampling.
Percentage[%]
- name: percentage, type: Double, default: 50, minimum: 0, maximum: 100, deprecated name: quantilePercent
Percentage values used e.g. for drop points and quantile Some values possibly of interest related to normal distribution histograms:
For a Gaussian distribution the following theoretical values might be of relevance:
At 1.0 sigma drop to 60.65% with 68.27% inside and 15.87% each above resp. below (about 1 in 3 outside, 1 in 6 above/below) At 1.5 sigma drop to 32.45% with 86.64% inside and 6.68% each above resp. below (about 1 in 7 outside , 1 in 15 above/below) At 1.96 sigma drop to 14.65% with ~95.00% inside and 2.5% each above resp. below(about 1 in 20 outside , 1 in 40 above/below) At 2.0 sigma drop to 13.53% with 95.45% inside and 2.275% each above resp. below(about 1 in 22 outside , 1 in 44 above/below) At 2.5 sigma drop to 4.393% with 98.75807% inside and 0.62% each above resp. below (about 1 in 81 outside , 1 in 161 above/below) At 3.0 sigma drop to 1.111% with 99.733002% inside and 0.135% each above resp. below (about 1 in 370 outside , 1 in 741 above/below) At 3.5 sigma drop to 0.219% with 99.953474% inside and 0.0233% each above resp. below (about 1 in 2149 outside , 1 in 4298 above/below)
(source https://en.wikipedia.org/wiki/68%E2%80%9395%E2%80%9399.7_rule and value look up in gnuplot renderings of exp(-x*x/2) or erf(x/sqrt(2) )
20% above / below @ ~0.841262 sigma with drop to 70.197% (above/below ~70% drop level ~ 20%) 10% above / below @ ~1.28155 sigma with drop to 43.991% (above/below ~44% drop level ~ 10%) 5.0% above / below @ ~1.64485 sigma with drop to 25.85% (above/below ~26% drop level ~ 5%) 2.5% above / below @ ~1.959964 sigma with drop to 14.65% (above/below ~15% drop level ~ 2.5%) 2.0% above / below @ ~2.053749 sigma with drop to 12.137% (above/below ~12% drop level ~ 2.0%) 1.5% above / below @ ~2.170090 sigma with drop to 9.4927% (above/below ~9.5% drop level ~ 1.5%) 1.0% above / below @ ~2.326348 sigma with drop to 6.680% (above/below ~6.7% drop level ~ 1.0%) 0.5% above / below @ ~2.57583 sigma with drop to 3.624% (above/below ~3.6% drop level ~ 0.5%) 0.25% above / below @ ~2.80703 sigma with drop to 1.945% (above/below ~1.95% drop level ~ 0.25%) 0.1% above / below @ ~3.09023 sigma with drop to 0.844% (above/below ~0.8% drop level ~ 0.1%) 0.05% above / below @ ~3.29052 sigma with drop to 0.445% (above/below ~0.4% drop level ~ 0.05%)
Correctness of these drop values values were approximately verified on a 200 cube float volume featuring Gaussian Noise with sigma = 1000 after strongly smoothing (with window 50) the histogram (taken with bin size 1).
See …FMEstable/ReleaseMeVis/Modules/ML/MLCurveUtils/networks/CurveFilter_ManualDropLevelTest.mlab
Constant Value
- name: constCurveParam, type: Double, default: 0
Value for first curve in list
Average Of Parameter
- name: averageOfParameter, type: Double, default: 0
Average over curve parameters over all curves in list
StdDev Of Parameter
- name: stdDevOfParameter, type: Double, default: 0
StdDev over curve parameters over all curves in list
Bin Size
- name: histogramBinSize, type: Double, default: 1, minimum: 0.001
Resample curve so it collects values into bins of this size
Use Step Function
- name: useStepFunction, type: Bool, default: TRUE
Draw histogram curve as a bar plot
Model Fitting Rel Center Of Drop Points
- name: ModelFittingRelCenterOfDropPoints, type: Bool, default: FALSE
Select if true max or center of peak value (from drop points) is used for parabola or secant model fitting