TraceView
Purpose
The module TraceView shows the current trace list and stack maintained by the error handler of the ML.
This allows for the analysis of the most recently called functions and the current call stack.
Windows
Default Panel
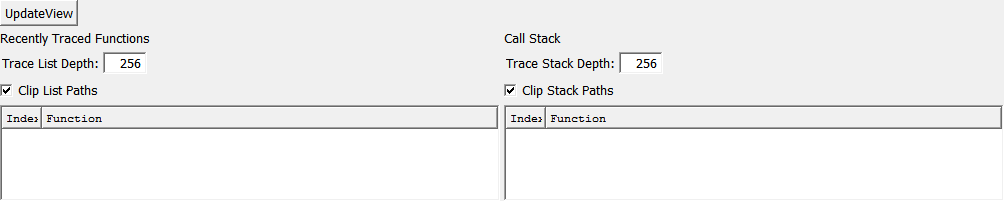
Parameter Fields
Field Index
|
|
|
|
|
|
|
Visible Fields
Trace List
- name: traceList, type: String, persistent: no
Shows the list of processed functions.
Trace List Depth
- name: traceListDepth, type: Integer, default: 256, minimum: 1, maximum: 65535
Shows the depth of the trace list.
Trace Stack
- name: traceStack, type: String, persistent: no
Shows the call stack of processed functions.
Trace Stack Depth
- name: traceStackDepth, type: Integer, default: 256, minimum: 1, maximum: 65535
Shows the depth of the trace stack.
Clip List Paths
- name: clipListPathes, type: Bool, default: TRUE
If checked, the list of trace paths is clipped which enhances the readability.
Clip Stack Paths
- name: clipStackPathes, type: Bool, default: TRUE
If checked, the list of stack paths is clipped which enhances the readability.
UpdateView
- name: update, type: Trigger
When pressed, the currently shown trace list and call stack are being updated.