| Chapter 17. Profiling | ||
|---|---|---|
 |  | |
| Chapter 17. Profiling | ||
|---|---|---|
| | | |
Table of Contents
The Profiling view generally measures time and memory consumption of modules in a network.
Profiling is a dynamic program analysis (as opposed to static code analysis) and is used to identify slow functions, frequently called functions, and memory usage during runtime. Outside of MeVisLab, a number of profilers exist: gprof, GlowCode, Valgrind, DevPartner/BoundsChecker.
The advantages of profiling in MeVisLab are:
Network performance can be analyzed by profiling at the C++ and Python levels, with an inherent awareness of MeVisLab entities like modules, PagedImages, etc.
No code recompilation is required.
No additional programs are required, which may make profiling faster.
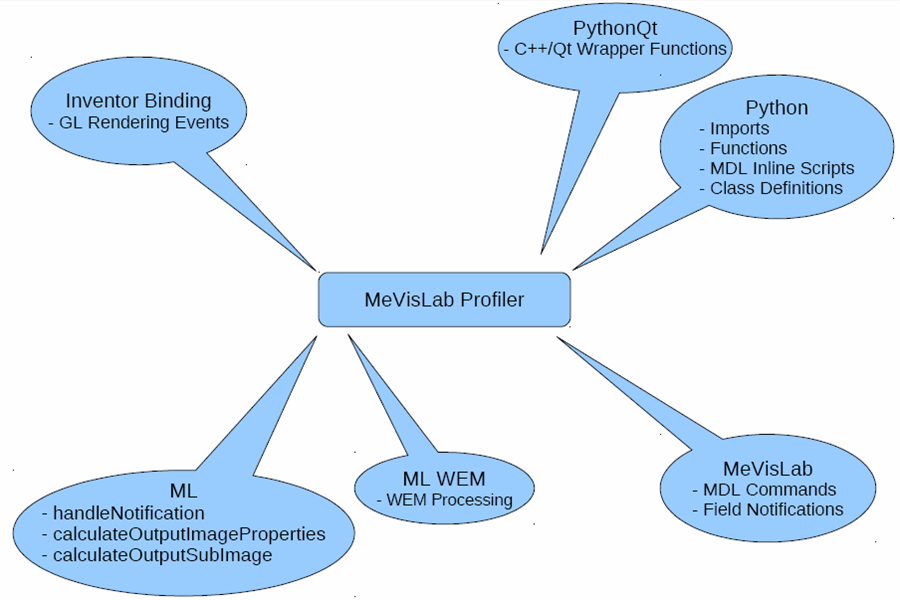
What can be profiled?
All ML modules offer profiling as it is implemented in the base class ml::Module.
WEM and CSO modules also support profiling of time consumption. However, in general, profiling of memory consumption is not supported, as this requires the memory to be managed by the internal memory manager of the ML. Thus, the memory managed by these modules is either not profiled at all, or only the portions of the module that use ML methods are profiled.
Python functions, scripts definitions, and Python Qt wrappers
Open Inventor bindings
MDL commands and field notifications
![[Note]](images/note.png) | Note |
|---|---|
The Profiling view marks processes that use multi-threading and shows only their accumulated time in this view. If you need detailed profiling information about each thread, use the view described in Chapter 9, ML Parallel Processing Profiler View. |
© 2026 MeVis Medical Solutions AG
| | | |
| 16.2. Parameter Connections Inspector Context Menu |  | 17.2. Using Profiling |