| 17.2. Using Profiling | ||
|---|---|---|
 | Chapter 17. Profiling |  |
| 17.2. Using Profiling | ||
|---|---|---|
| | Chapter 17. Profiling | |
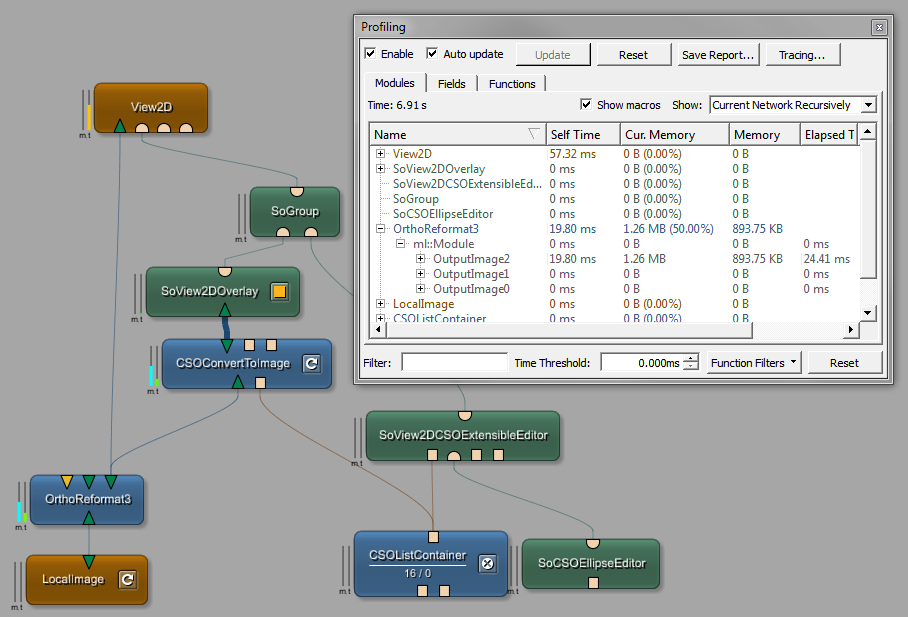
In the Profiling View, the modules of networks to be profiled are listed.
Entries have the same color as corresponding modules (brown for macros, blue for ML modules, and green for Inventor modules).
Entries are italicized if the module has been deleted (not just removed).
The consumption is also displayed in the network: Two vertical bars to the left of a module indicate the percentage of memory (m) consumption and time (t) consumption of that module in the current network.
The memory bar's color ranges from green over teal to magenta (for 0%..50%..100%).
The CPU time bar's color ranges from green over yellow to red (for 0%..50%..100%).
That means that small green dots indicate low memory/time consumption while full magenta or red bars indicate high memory or time consumption. The colors are chosen to make memory and time easy to distinguish from each other.
The Profiling View and the network are linked as follows:
Clicking an entry on the Modules tab selects the module in the network (and vice versa).
Double-clicking an entry on the Modules tab navigates to the module or, in the case of a scripting function being counted, to the line of the scripting in MATE (this also works for modules inside macros).
Options:
Enable: Enables the profiling and toggles the visualization of the relative time/memory consumption of the modules.
Auto update: Enables the automatic display of profiling results every second.
Filters visible (Functions only): Enables the display of the filter section for function filtering, see Figure 17.9, “Functions with Filters Visible”.
Buttons:
Update: (Only if no auto-update is set) Updates the displayed results manually.
Reset: Resets the list of modules and the profiling results. Memory/cache that is still in use will remain listed in the Current Memory column.
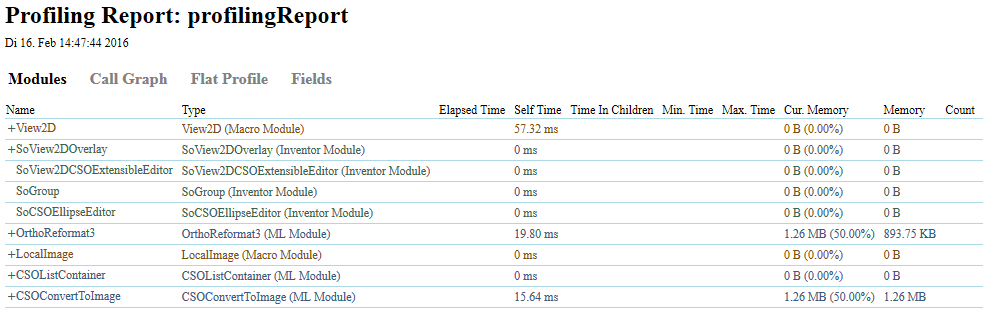
Save report: Generates an HTML page with reports for Modules, Call Graph, Flat Profile (for functions), and Fields.
On the Modules tab, the modules and their profiling information are listed. When hovering over the headings, a context-sensitive tooltip is displayed for each.
Options:
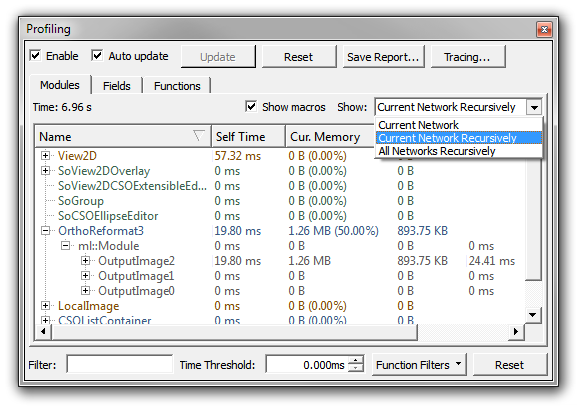
Show macros: If enabled, it shows information about macros in the network and modules inside the macro as a tree. If disabled, the information is presented flat, without the macros.
Show: Defines which networks and depths should be profiled:
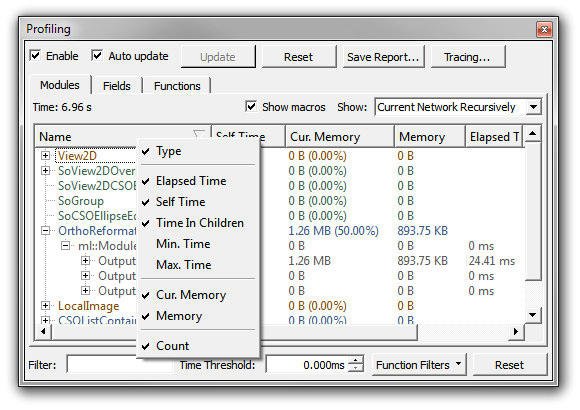
Right-clicking the headings opens a context menu where the columns to be displayed can be configured.
Type: Shows the type of the module.
Elapsed Time: Shows the total time spent in the profiled routines (the sum of self-time and time in children).
Self Time: Shows the time spent only in routines of the module.
Time In Children: Shows the time spent in routines called by the module.
Min. Time: Shows the minimum measured total time.
Max. Time: Shows the maximum measured total time.
Cur. Memory: Shows the memory currently allocated by the module.
Memory: Shows the total accumulated memory allocated by the module to ML pages during profiling.
Count: Shows a counter of method calls. Expand a module's node to see the details; for example, the calls to calculateOutputImageProperties and to calculateOutputSubImage are counted, Page Cache hits and misses are counted, and calls to scripting methods are counted. On mouse-over, details are displayed.
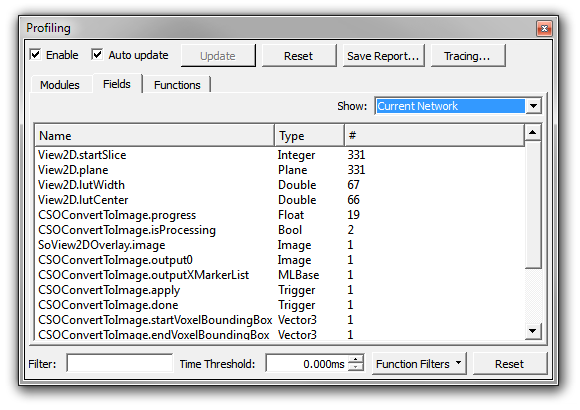
On the Fields tab, all fields that have been touched at least once are listed here.
Name Shows the field name.
Type : Shows the field type.
#: Shows the number of field triggers (notifications).
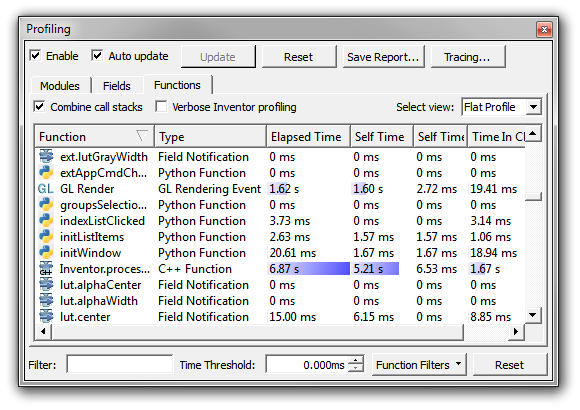
On the Functions tab, all functions that have been called at least once are listed here.
Right-clicking the headings opens a context menu where the displayed columns can be configured.
Type: Shows the function type. The possible types are listed under the Function filters button.
Elapsed Time: Shows the total time spent in the profiled functions (the sum of self-time and time in children).
Elapsed Time Per Call: Shows the time spent per call.
Self Time: Shows the total time spent only in functions of the module.
Self Time Per Call: Shows the time spent in functions of the module per call.
Time In Children: Shows the time spent in routines called by the module.
Calls: Shows the total number of calls for this function (only in Flat Profile view).
Two display options are available under Select view:
Flat Profile: Shows the functions in a flat list. No hierarchy/dependency is visible. Calls of the same function are automatically bundled and summed up.
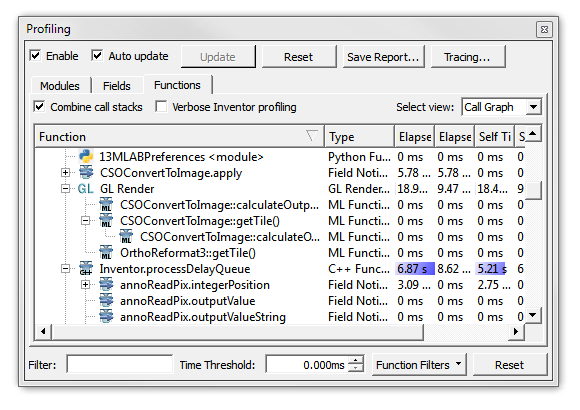
Call Graph: Shows the functions in the hierarchy they were called in. In the case of types that should be not be displayed due to filtering, these types may still appear if the functions to be displayed are below them in the hierarchy.
Double-clicking a function navigates to the module the function is called in, even if it is in the network of a macro module.
The option Reduce call graph (resets profiling) combines all calls of the same function to one entry in the call graph list.
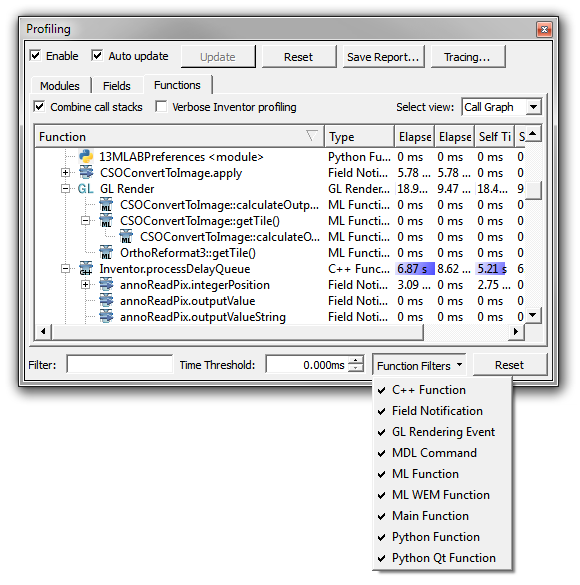
When Filters visible is selected, the functions filter options are displayed.
Options:
Filter: A text field where the filter text can be entered.
Time Threshold: Sets a value below which the row is filtered, making more time-consuming functions more visible.
Buttons:
Function Filters: Opens a list of all function types to filter which types should be displayed. Checked types are shown.
Reset: Deletes entries in Filter and Time threshold, and resets the Function filters so that all types are listed again.
The function types have different icons in the list:
Table 17.1. Function Type Icons
| Type | Icon |
|---|---|
| ML call (typically ML image) |
|
| ML WEM call |
|
| Field call (Field notification) |
|
| Python call |
|
| Python Qt call |
|
| Open GL call |
|
Some special functions:
main: Pseudo function that is active when profiling is enabled.
__tmpScriptHandler: Generated Python functions for MDL inline code (“py:some python code”).
ScriptFile <inline script definition>: Definition of inline script functions.
PyModuleName <module>: Code executed at the Python module level, which is not contained within any function; typically invoked when importing Python modules.
<python qt wrapper>: PythonQt wrappers of Qt functions.
© 2026 MeVis Medical Solutions AG
| |  | |
| Chapter 17. Profiling |  | Chapter 18. Recent Outputs |