| Chapter 9. ML Parallel Processing Profiler View | ||
|---|---|---|
 |  | |
| Chapter 9. ML Parallel Processing Profiler View | ||
|---|---|---|
| | | |
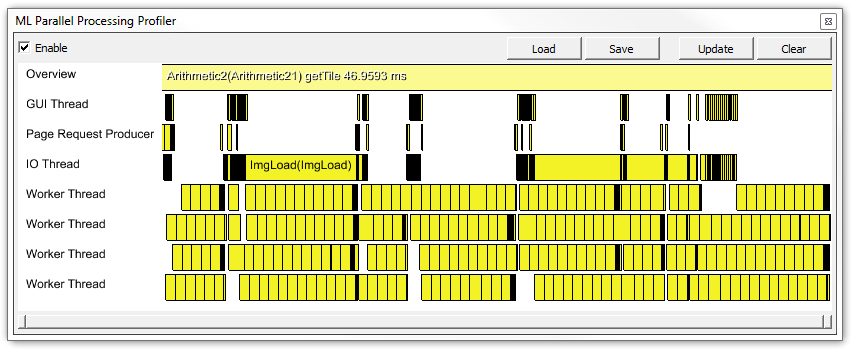
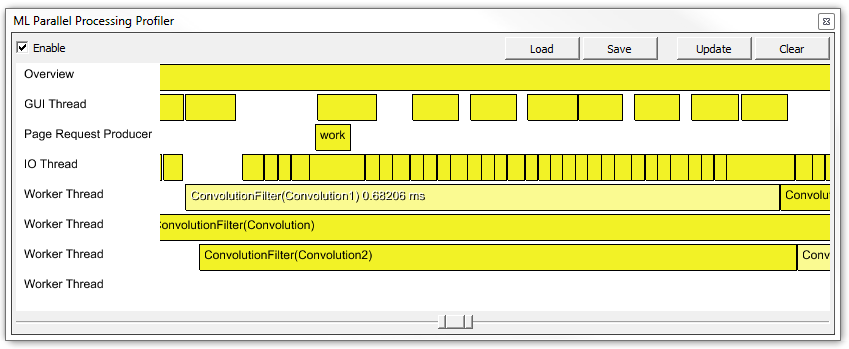
The ML Parallel Processing Profiler View shows the workload of all threads and how much time they needed.
The view shows a zoomable graph and provides the following options:
Enable: If checked, the view tracks the time consumption of each used thread. Press Update to refresh the view.
Load: Loads a previously saved *.timeline file.
Save: Saves a profiling result as a *.timeline file.
Update: Updates the view with the latest results.
Clear: Clears all profiling data and clears the view.
The graph shown in the view provides an overview of how many threads have been used and the duration of their work on individual requests. The graph can be zoomed using the mouse wheel or by interacting with the scrollbar.
On mouse-over, individual work packages show the module's name and its instance name that produced the work, and the time taken to process the work package.
© 2026 MeVis Medical Solutions AG
| | | |
| Chapter 8. Debug Output |  | Chapter 10. Module Browser |