DynaCurve
- MLModule
genre
author
package
dll
definition
see also
keywords
Purpose
The module DynaCurve extracts dynamic time curves from the input image.
Usage
The DynaCurve module reads voxel values from its input image at specified positions for all time points available and computes ml.CurveData objects from these values. The curves are available as a ml.CurveList object at the outCurveList field, which can be connected, e.g., to a SoDiagram2D module.
Details
The positions from which the voxel values are read can be specified by a list of point markers or by a list of contours or ROIs.
The output curves are generated in the order found in the point or ROI list. If both point and ROI curves are generated, the point curves appear first in the output curve list.
Windows
Default Panel

Input Fields
input0
- name: input0, type: Image
Input image to compute curva data out of.
inPointList
- name: inPointList, type: Vec3fList/XMarkerList(MLBase), deprecated name: inputPointList
Specifies the point where voxel values are extracted.
For accessing this object via scripting, see the Scripting Reference:
MLXMarkerListWrapper.
inContourList
- name: inContourList, type: SEGContourList(MLBase), deprecated name: inputContourList
Specifies the ROIs where voxel values are extracted.
Output Fields
outCurveList
- name: outCurveList, type: CurveList(MLBase), deprecated name: outputCurveList
A CurveList containing values obtained from the image data at all time points.
For accessing this object via scripting, see the Scripting Reference:
MLCurveListWrapper.
Parameter Fields
Field Index
|
|
|
|
|
|
|
|
|
|
|
|
|
|
|
Visible Fields
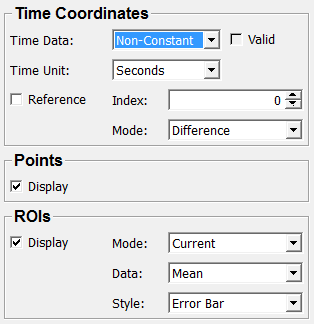
Display (displayPoints)
- name: displayPoints, type: Bool, default: TRUE
If checked, the points are displayed in the curve data.
Display (displayROIs)
- name: displayROIs, type: Bool, default: TRUE
If checked, the ROIs are displayed in the curve data.
Mode (ROIMode)
- name: ROIMode, type: Enum, default: Current
Defines the ROI creation mode.
Values:
Title |
Name |
Description |
|---|---|---|
Current |
Current |
Creates a single curve object for the current ROI in the contour list. |
All |
All |
Creates curve objects for all ROIs in the contour list. |
Data
- name: ROIData, type: Enum, default: Mean
Defines the computation mode in ROIs.
Values:
Title |
Name |
Deprecated Name |
Description |
|---|---|---|---|
Mean |
Mean |
Computes the mean value in a ROI. |
|
Mean + Min/Max |
MeanPlusMinMax |
Mean + Min/Max |
Computes the mean value and the min/max values in a ROI. |
Mean +/- StdDev |
MeanAndStdDev |
Mean +/- StdDev |
Computes the mean value and the standard deviation in a ROI. |
Min/Max Range |
MinMaxRange |
Min/Max Range |
Computes the min/max value range in a ROI. |
StdDev |
StdDev |
Computes the standard deviation in a ROI. |
|
Rel. StdDev |
RelStdDev |
Rel. StdDev |
Computes the relative standard deviation in a ROI. That is the standard deviation value divided by the mean value in a ROI. |
Style
- name: ROIStyle, type: Enum, default: ErrorBar
Defines the appearance of ROIs in a curve.
Values:
Title |
Name |
Deprecated Name |
Description |
|---|---|---|---|
Error Bar |
ErrorBar |
Error Bar |
The mean value is displayed as a line curve and the min/max or standard deviation values are displayed as error bars. |
Area |
Area |
Mean values and min/max or standard deviation values are displayed as line curves, and the area between the outer curves is filled. |
Index
Reference
Mode (refTimeMode)
- name: refTimeMode, type: Enum, default: Difference
Defines how the output curves are computes from the input image.
Only available if
Referenceis checked.
Values:
Title |
Name |
Description |
|---|---|---|
Difference |
Difference |
Difference to the reference time point. |
Ratio |
Ratio |
Quotient between current and reference time point. |
Rel. Enhancement |
RelEnhancement |
Relative difference (in percent) to the reference time point. |
Clone |
Clone |
Original image voxel values. |
Neg Log Of Ratio |
NegLogOfRatio |
Negative logarithm of the Ratio. |
Time Unit
- name: timeUnit, type: Enum, default: Seconds
Defines the units in which the time axis information is stored in the output curves.
Values:
Title |
Name |
|---|---|
Seconds |
Seconds |
Minutes |
Minutes |
Time Data
- name: timeData, type: Enum, default: NonConstant
Defines the inclusion of explicit time axis information in the output curves.
Values:
Title |
Name |
Deprecated Name |
Description |
|---|---|---|---|
Off |
Off |
No time axis information is included. |
|
On |
On |
The time axis data include valid time points of the input image. |
|
Non-Constant |
NonConstant |
Non-Constant |
The time axis data include only non-constant time points of the input image. |
Valid
- name: timeDataValid, type: Bool, persistent: no
Shows whether time point information is present in the output curves.