CurveCursor
- MLModule
genre
author
package
dll
definition
see also
keywords
Purpose
The module CurveCursor picks a data value from a curve at a given position and/or displays a graphical cursor above a ml.CurveData or a ml.CurveList.
Usage
The CurveCursor module accepts a ml.CurveData or ml.CurveList object at its inCurveList field and displays the curve data value of a selected curve series at a given position specified as Position X.
In addition, it adds a curve cursor, consisting of a vertical line at the x-position and/or a horizontal line at the y-position, to the input curves. The resulting CurveList object is available at the outCurveList field.
Tips
If no input curves are present, the only valid value for Series Index is -1 and the output curve list contains nothing but the curve cursor.
In this situation, the size of the vertical and horizontal cursor indicators has to be explicitly specified in the fields Range X: Min, Max, Range Y: Min, and Max. As soon as input curves are present, these fields reflect the x/y range as obtained from the input curves.
Windows
Default Panel
Input Fields
inCurveList
- name: inCurveList, type: CurveData/CurveList(MLBase), deprecated name: inputCurves
The input field accepts a CurveData or a CurveList object.
For accessing this object via scripting, see the Scripting Reference:
MLCurveDataWrapper.
Output Fields
outCurveList
- name: outCurveList, type: CurveList(MLBase), deprecated name: outputCurveList
The output field provides the resulting CurveList object including the curve cursor.
For accessing this object via scripting, see the Scripting Reference:
MLCurveListWrapper.
Parameter Fields
Field Index
|
|
|
|
|
|
|
|
|
|
|
|
|
|
|
Visible Fields
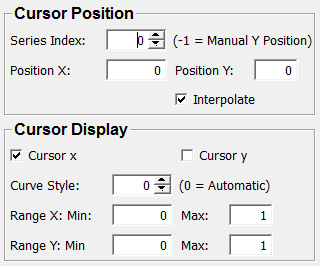
Position X
- name: posX, type: Double, default: 0
Sets the x-position at which the selected curve data is evaluated.
Position Y
- name: posY, type: Double, default: 0
Sets the value of the specified curve series at the
Position X.
Series Index
- name: seriesIndex, type: Integer, default: 0, minimum: -1
Sets the index of the curve series to be used.
Numbering starts with 0 for the first series in the first input curve. If the
Series Indexis set to -1, thePosition Yis not taken from a curve series but can be specified manually instead. This can be used to display a curve cursor that is not restricted to points on a curve.
Interpolate
- name: interpolate, type: Bool, default: TRUE
If checked, the curve data value is interpolated between adjacent data points; otherwise, the value of the nearest data point is used.
Range X: Min
- name: minX, type: Double, default: 0
Sets the x-range of the horizontal cursor if no input curve is present.
Max (maxX)
- name: maxX, type: Double, default: 1
Sets the x-maximum of the horizontal cursor if no input curve is present.
Range Y: Min
- name: minY, type: Double, default: 0
Sets the y-range of the vertical cursor if no input curve is present.
Max (maxY)
- name: maxY, type: Double, default: 1
Sets the y-maximum of the vertical cursor if no input curve is present.
Cursor X
- name: cursorX, type: Bool, default: TRUE
If checked, the x-position indicator is enabled.
Cursor Y
- name: cursorY, type: Bool, default: FALSE
If checked, the y-position indicator is enabled.
Curve Style
- name: curveStyle, type: Integer, default: 0, minimum: 0
Sets the style to be used for drawing the cursor.
Its value is an index into a
StylePalette. If theCurve Styleis set to 0, and if aStylePaletteis used, the styles for the curve cursor is chosen automatically.If both
Cursor XandCursor Yare enabled, this may result in a curve cursor displayed in two different styles, because the vertical and the horizontal indicator of the curve cursor are represented as two distinct curve objects in the output curve list.