| 4.6. Extras Menu | ||
|---|---|---|
 | Chapter 4. Menu Bar |  |
| 4.6. Extras Menu | ||
|---|---|---|
| | Chapter 4. Menu Bar | |
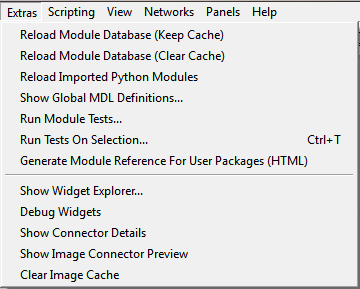
Reloads the .def, .script, and .py files of modules that have
been changed after the last reload. Use this to
Add newly defined modules to the module database.
Update changes of module interfaces and scripting.
Reloads all modules in the database like Section 4.6.1, “Reload Module Database (Keep Cache)” but clears the cache.
![[Note]](images/note.png) | Note |
|---|---|
This may be slow, especially if many module panels are currently open in the network(s). To update current changes on module interfaces and scripting faster, use Section 4.6.1, “Reload Module Database (Keep Cache)”. |
This feature is only relevant if using the Python import functionality and working on the imported modules.
Reloads imported Python modules (not MeVisLab modules that use Python). This was previously only possible via a manual reload() call or a MeVisLab restart.
| Note |
|---|---|
After the Python modules have been reloaded, reload the MeVisLab modules that make use of the Python module(s). Otherwise, the MeVisLab modules will still see the previously imported Python modules. |
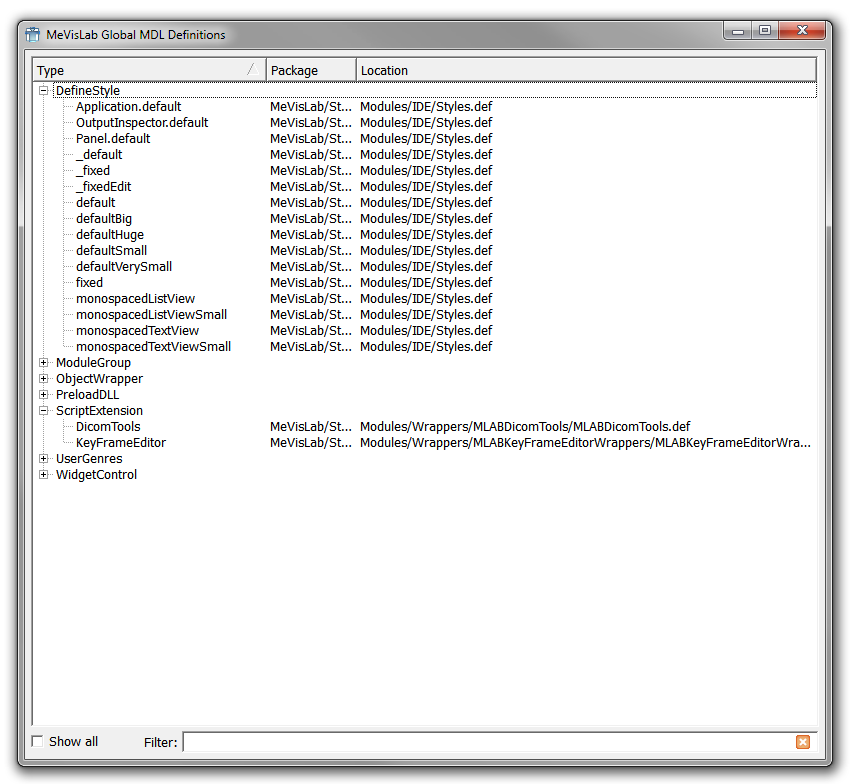
This entry displays a list of special objects defined in the MDL, sorted by object category. This is useful to, e.g., find special control types that might not be listed in the MDL Reference.
By default, the list only contains the most useful object categories. Checking the “Show All” option shows (almost) all object categories, but most of them are not immediately useful since they contain MeVisLab internals.
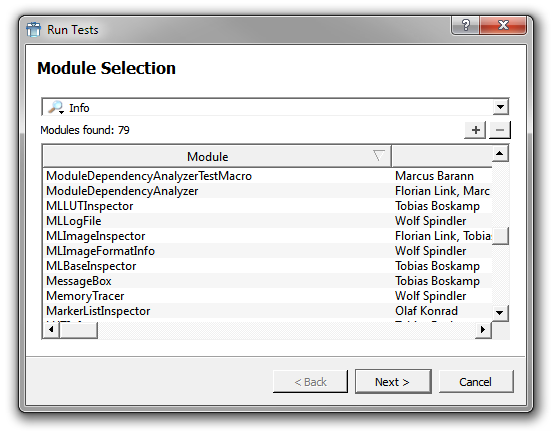
Starts the TestCenter for a module selection, by default for the modules selected in the Module
Search browser window (see Chapter 13, Module Search). By changing the filter settings in the extra window, other modules can be selected for testing. For all modules, the test cases associated with the module(s) are listed here. In case of TestWebView, only the generic test case “Formal” that is associated with all modules are available. When Finish is clicked, the test cases are run and test reports are available.
![[Tip]](images/tip.png) | Tip |
|---|---|
To run tests on several modules in a network, select them, open the network context menu and select Run Tests On Selection...; or use the menu entry of the same name in the Extras menu. For single modules, start the tests via the module context menu. |
For further information, see the TestCenter Reference and the Getting Started, chapter 16, “Using the TestCenter”.
Selects the tests associated with the currently selected modules and shows a dialog from which these tests can be started.
Creates an HTML index for the help files of modules in the user packages (one index for each PackageGroup).
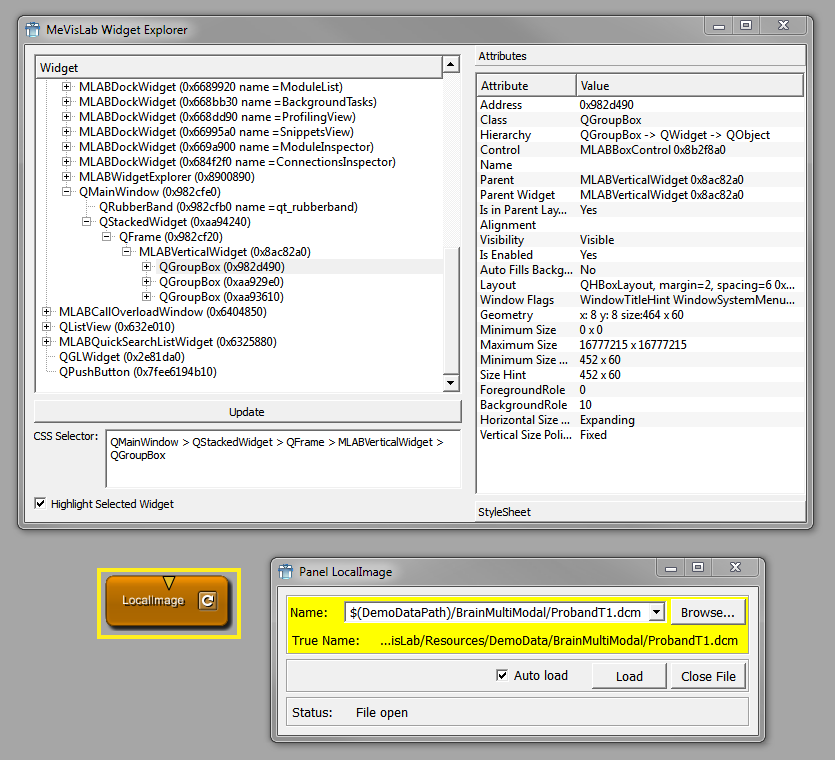
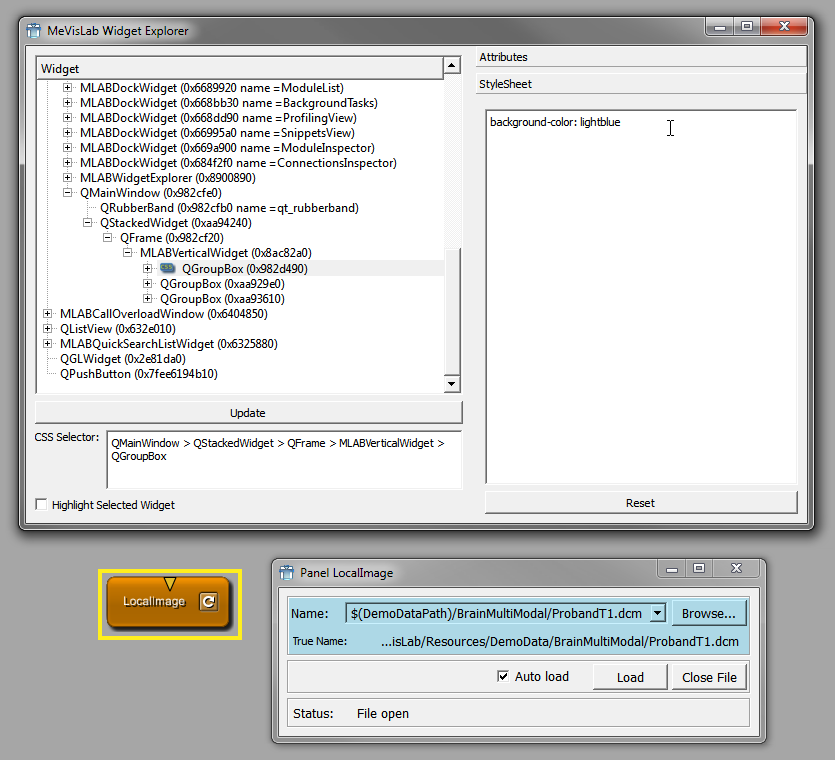
The Widget Explorer is useful for developing Qt style sheets. It can also be used for debugging module panels.
On the left side are
The Widget view displays all existing windows and widgets of the MeVisLab process hierarchically (see Figure 4.20, “MeVisLab Widget Explorer - Attributes Inspector”).
The Update button can be clicked to refresh the view when the GUI changes and new windows are shown.
The CSS Selector area shows the class hierarchy of the currently selected widget (this can be useful for writing CSS rules).
The Highlight Selected Widget checkbox toggles if the background color of the currently selected widget is temporarily changed to yellow to ease locating the widget in the GUI (note that this does not work for all widgets, because not all draw their background themselves).
On the right side are
The Attributes inspector that shows the widget attributes.
The StyleSheet editor that allows for viewing and testing style sheet rules (see Figure 4.21, “MeVisLab Widget Explorer - Style Sheet Editor”).
Enables/disables debugging module panels. CTRL+left-clicking a user interface control in a module panel opens the .script file (MDL source code of the GUI) in MATE at the line where this GUI control is defined.
| Note |
|---|---|
To be able to jump to the definition line of the user
interface control with any other text editor than MATE, the parameter |
Shows detailed information about image, Inventor, or Base object properties currently pending on module's connectors. Activated when selecting a single module in the network. This is the same option as Connector Detail Info in the Preferences, see Section 4.3.7, “Preferences — Network Appearance”
Shows an image preview at the module's image connectors when a single module is selected in the network. This is the same option as Connector Image Preview in the Preferences, see Section 4.3.7, “Preferences — Network Appearance”.
© 2025 MeVis Medical Solutions AG
| |  | |
| 4.5. Applications Menu |  | 4.7. Scripting Menu |