SoAxis
- InventorModule
genre
author
package
dll
definition
see also
keywords
Purpose
The module SoAxis renders a 3D coordinate system in an Open Inventor scene.
The coordinate system can show ticks, subticks, annotations, and a bounding box. The size can automatically adapt to an input ML image.
Please note that it is best to render the SoAxis as the last shape in your scene, this allows for alpha-blending the text on top of the rendering.
Tips
You might also have a look at SoCoordinateSystem, which has a subset of the functionality, but is better implemented.
Windows
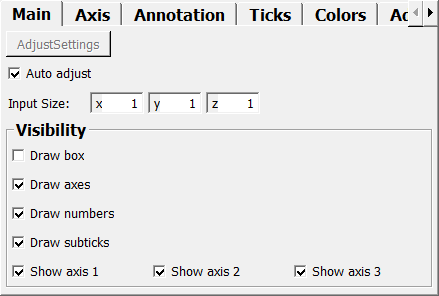
Default Panel
Input Fields
inputImage
- name: inputImage, type: Image
The input image is optional; if available, then with the extents can be adapted according to the connected image; see
Auto adjustandAdjustSettingsfor details.
Output Fields
self
- name: self, type: SoNode
The connector to other Open Inventor modules.
Parameter Fields
Field Index
Visible Fields
AdjustSettings
- name: adjustSettings, type: Trigger
When pressed, the size of the coordinate system is adjusted to the input ML image.
Auto adjust
- name: autoAdjustSettings, type: Bool, default: TRUE
If checked, the size of the coordinate system is automatically adjusted on every change of the input ML image.
Input Size
- name: axisVolumeSize, type: Vector3, default: 1 1 1
Sets the size of the coordinate system.
Draw axes
- name: axisOn, type: Bool, default: TRUE
If checked, the chosen components are rendered.
If unchecked, nothing is rendered at all.
Font Size
- name: axisFontSize, type: Integer, default: 12, minimum: 6, maximum: 128
Sets the size of the font to be used for annotation and number texts.
Show axis 1
- name: axis1Visibility, type: Bool, default: TRUE
If checked, the first axis is rendered.
Show axis 2
- name: axis2Visibility, type: Bool, default: TRUE
If checked, the second axis is rendered.
Show axis 3
- name: axis3Visibility, type: Bool, default: TRUE
If checked, the third axis is rendered.
Draw numbers
- name: axisNumberingOn, type: Bool, default: TRUE
If checked, the axes are annotated with numbers.
Draw subticks
- name: axisSubTickingOn, type: Bool, default: TRUE
If checked, subticks are rendered between ticks.
XYLines
- name: multiAxisXY, type: Bool, default: FALSE
If checked, lines are rendered in the XY plane.
XZLines
- name: multiAxisXZ, type: Bool, default: FALSE
If checked, lines are rendered in the XZ plane.
YXLines
- name: multiAxisYX, type: Bool, default: FALSE
If checked, lines are rendered in the YX plane.
YZLines
- name: multiAxisYZ, type: Bool, default: FALSE
If checked, lines are rendered in the YZ plane.
ZXLines
- name: multiAxisZX, type: Bool, default: FALSE
If checked, lines are rendered in the ZX plane.
ZYLines
- name: multiAxisZY, type: Bool, default: FALSE
If checked, lines are rendered in the ZY plane.
Axis1 (axis1Text)
- name: axis1Text, type: String, default: X
Sets the text denoting the first axis.
Axis2 (axis2Text)
- name: axis2Text, type: String, default: Y
Sets the text denoting the second axis.
Axis3 (axis3Text)
- name: axis3Text, type: String, default: Z
Sets the text denoting the third axis.
Axis1 (numPrefix1Text)
- name: numPrefix1Text, type: String
Sets a text string that is added as prefix (or postfix) before (or after) numbers, which are drawn next to the ticks of the axis.
This can be useful to add unit strings, or only spaces when numbers tend to be drawn to near to the axis lines.
Axis2 (numPrefix2Text)
Axis3 (numPrefix3Text)
Axis1 (numPostfix1Text)
Axis2 (numPostfix2Text)
Axis3 (numPostfix3Text)
Axis1 (axisText1AlignMode)
- name: axisText1AlignMode, type: Enum, default: Axis::AXIS_TEXT_ALIGN_LEFT
Defines the alignment of the text drawn at tip ends of the axis.
Values:
Title |
Name |
Description |
|---|---|---|
LEFT |
Axis::AXIS_TEXT_ALIGN_LEFT |
The text is drawn right from the calculated drawing position. |
CENTER |
Axis::AXIS_TEXT_ALIGN_CENTER |
The text is drawn centered at the calculated drawing position. |
RIGHT |
Axis::AXIS_TEXT_ALIGN_RIGHT |
The text is drawn left from the calculated drawing position. |
Axis2 (axisText2AlignMode)
Axis3 (axisText3AlignMode)
Axis1 (axisNumber1AlignMode)
- name: axisNumber1AlignMode, type: Enum, default: Axis::AXIS_TEXT_ALIGN_LEFT
Defines the alignment of the number strings drawn at ticks of the axis.
Values:
Title |
Name |
Description |
|---|---|---|
LEFT |
Axis::AXIS_TEXT_ALIGN_LEFT |
The text is drawn right from the calculated drawing position. |
CENTER |
Axis::AXIS_TEXT_ALIGN_CENTER |
The text is drawn centered at the calculated drawing position. |
RIGHT |
Axis::AXIS_TEXT_ALIGN_RIGHT |
The text is drawn left from the calculated drawing position. |
Axis2 (axisNumber2AlignMode)
Axis3 (axisNumber3AlignMode)
Num Bias
- name: axisNumBias, type: Vector3, default: 0 0 0
Sets a value that is added to the annotations of the ticks.
Num Scale
- name: axisNumScale, type: Vector3, default: 1 1 1
Sets a scale factor for scaling the numbers annotating the ticks.
Steps (axisStepSizes)
- name: axisStepSizes, type: Vector3, default: 0.100000001490116 0.100000001490116 0.100000001490116
Sets distance values between the ticks.
Origin
- name: axisOrigin, type: Vector3, default: 0 0 0
Sets the origin of the coordinate system.
Axis Min
- name: axisMinEnds, type: Vector3, default: 0 0 0
Sets the minimum values of the axes’ ticks.
Axis Max
- name: axisMaxEnds, type: Vector3, default: 1 1 1
Sets the maximum values of the axes’ ticks.
Length
- name: axisMarkerLength, type: Vector3, default: 0.0500000007450581 0.0500000007450581 0.0500000007450581
Sets the length of the ticks.
Num Min
- name: axisTicksMin, type: Vector3, default: 0 0 0
Sets the minimum number for ticks.
Num Max
- name: axisTicksMax, type: Vector3, default: 1 1 1
Sets the maximum number for ticks.
Axis1Color
- name: axis1Color, type: Color, default: 1 1 1
Sets the color for the first axis.
Alpha (axis1Transparency)
- name: axis1Transparency, type: Float, default: 1, minimum: 0, maximum: 1
Sets the transparency for the first axis.
Axis2Color
- name: axis2Color, type: Color, default: 1 1 1
Sets the color for the second axis.
Alpha (axis2Transparency)
- name: axis2Transparency, type: Float, default: 1, minimum: 0, maximum: 1
Sets the transparency for the second axis.
Axis3Color
- name: axis3Color, type: Color, default: 1 1 1
Sets the color of the third axis.
Alpha (axis3Transparency)
- name: axis3Transparency, type: Float, default: 1, minimum: 0, maximum: 1
Sets the transparency for the third axis.
Wing Length
- name: axisWingLength, type: Vector3, default: 0.0333333350718021 0.0333333350718021 0.0333333350718021
Sets the lengths of the ending arrows at the axes.
Axis Overscale
- name: axisOverScale, type: Vector3, default: 1.10000002384186 1.10000002384186 1.10000002384186
Sets a scale factor for over-scaling the lengths of the axes in respect to the set input size.
Steps (axisSubTickSteps)
- name: axisSubTickSteps, type: Vector3, default: 0.200000002980232 0.200000002980232 0.200000002980232
Sets a step value for subticks.
Scales
- name: axisSubTickScales, type: Vector3, default: 0.25 0.25 0.25
Sets a scale factor for the lengths of subticks.
Draw box
- name: boxOn, type: Bool, default: FALSE
If checked, a bounding box is shown.
Box Color
- name: boxColor, type: Color, default: 1 1 1
Sets the color of the bounding box.
Alpha (boxTransparency)
- name: boxTransparency, type: Float, default: 1, minimum: 0, maximum: 1
Sets a transparency value of the bounding box.