PCLFeatureHistogram
- MLModule
genre
author
package
dll
definition
inherits from
keywords
Purpose
Calculates the pcl::FeatureHistogram on the input point cloud, passes the meanValue to Mean Value, and converts the histogram to an CurvaData object available at outputHistogramCurve. See pcl::PCA for details.
Windows
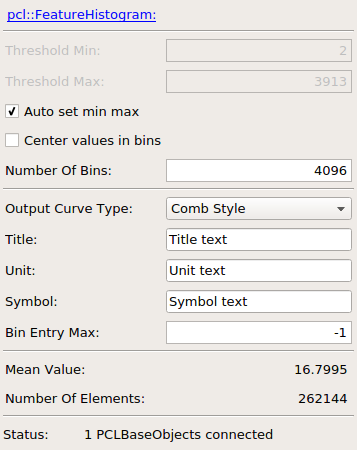
Default Panel
Input Fields
inputPCLObject0
- name: inputPCLObject0, type: MLBase
Connect the point cloud whose properties shall be calculated and whose projection shall be passed to the output.
Output Fields
outputHistogramCurve
- name: outputHistogramCurve, type: MLBase
Provides the calculated histogram as CurveData object. If no histogram is available then an empty curve is provided.
Parameter Fields
Field Index
|
|
|
|
|
|
|
|
|
|
|
|
|
|
|
Visible Fields
Status
- name: status, type: String, persistent: no
see PCLModule.status
Threshold Min
- name: thresholdMin, type: Float, default: 0
The lower limit of the histogram range, all smaller values are not included in histogram calculations.
Threshold Max
- name: thresholdMax, type: Float, default: 1
The high limit of the histogram range, all higher values are not included in histogram calculations.
Auto Set Min Max
- name: autoSetMinMax, type: Bool, default: TRUE
If checked then
Threshold MinandThreshold Maxare automatically determined from input values, otherwise the values from the input fields are used. As an example: if input values are from [1,3] and four bins are used thenThreshold Minis set to 1 andThreshold Maxto [3-1]/4 +
Center Values In Bins
- name: centerValuesInBins, type: Bool, default: TRUE
If enabled then a half width of a bin is added to the values before they are inserted into the histogram to round them appropriately.
Number Of Bins
- name: numberOfBins, type: Integer, default: 65536
The number of bin to be used in the histogram.
Mean Value
- name: meanValue, type: Float, persistent: no
Outputs the mean value of the calculated histogram.
Number Of Elements
- name: numberOfElements, type: Integer, persistent: no
Output field showing the number of values which were not skipped at [
Threshold Min,Threshold Max] and which were truly added to the histogram.
Bin Entry Max
- name: binEntryMax, type: Integer, default: -1
Defines the maximum value of bin entries to be shown in the output curve; -1 means unlimited. The data of the internally histogram itself is not changed nor
Mean ValueorNumber Of Elementsare changed. It is useful to limit the height of the displayed curve to be able to check areas with lower values. In this way huge peaks can be cut and smaller ones can be examined.
Output Curve Type
- name: outputCurveType, type: Enum, default: CombStyle
Determines the format of the output curve.
Values:
Title |
Name |
Description |
|---|---|---|
Comb Style |
CombStyle |
The first entry of the output curve will be a point ( |
Bin Value Pairs |
BinValuePairs |
The output curve is filled only with pairs containing the bin index with its corresponding number of entries. |
Title
- name: title, type: String, default: Histogram
The string to be set as curve title.
Unit
- name: unit, type: String
The string to be set as curve unit.
Symbol
- name: symbol, type: String
The string to be set as curve symbol.