PCLClusterStatisticsToInventor
- MLModule
genre
author
package
dll
definition
see also
inherits from
keywords
Purpose
PCLClusterStatisticsToInventor generates an Open Inventor scene which displays some contents of a PCLClusterStatistics module. It also provides some options to change colors and visibility of some components. For each cluster it can display
the center of gravity (as sphere)
the intersection of the line defined by the center of gravity and the eigenvector correlated to the largest eigenvalue and the user defined plane (see
PCLClusterStatistics.planePointandPCLClusterStatistics.planeNormal) (as sphere)the oriented extents (as lines)
a line between center of gravity and the plane intersection described above.
Windows
Default Panel
Input Fields
inputStatistics
- name: inputStatistics, type: MLBase
The connector to a
PCLClusterStatisticswhich contains the results to be displayed.
Output Fields
outputSoClusterStatistics
- name: outputSoClusterStatistics, type: SoNode
The connector to be added to an Inventor group node. All displayed components are located under a
SoSeparatorand should not influence any subsequent parts of the scene graph.
Parameter Fields
Field Index
|
|
|
|
|
|
|
|
|
|
|
Visible Fields
Status
- name: status, type: String, persistent: no
see PCLModule.status
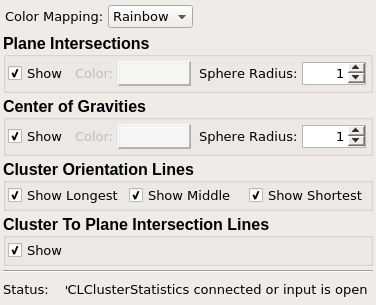
Show (showPlaneIntersection)
- name: showPlaneIntersection, type: Bool, default: TRUE
The intersection points of clusters defined in
PCLClusterStatistics.clusterPlaneIntersectionsare displayed as spheres. See also seePCLClusterStatistics.planePointandPCLClusterStatistics.planeNormal.
Show (showClusterToPlaneIntersectionLine)
- name: showClusterToPlaneIntersectionLine, type: Bool, default: TRUE
If checked then a dotted line between the center of gravity of each cluster to the correlated plane intersection is displayed, otherwise no such line is shown.
Color (planeIntersectionColor)
- name: planeIntersectionColor, type: Color, default: 1 1 1
If intersection points of clusters defined in
PCLClusterStatistics.clusterPlaneIntersectionsare displayed as spheres andColor Mappingis MAP_VALUE_TO_COLOR then this color is used for that sphere. Otherwise it is not used.
Sphere Radius (planeIntersectionSphereRadius)
- name: planeIntersectionSphereRadius, type: Float, default: 1
If intersection points with the user plane are displayed as spheres then this defines their radius, otherwise it is ignored and insensitive.
Show (showCenterOfGravity)
- name: showCenterOfGravity, type: Bool, default: TRUE
If checked then the center of gravity (see
PCLClusterStatistics.clusterCenterOfGravitiesof each cluster is displayed as sphere, otherwise it is not shown.
Color (centerOfGravityColor)
- name: centerOfGravityColor, type: Color, default: 1 1 1
If
Color Mappingis MAP_VALUE_TO_COLOR then this color is used for most displayed cluster objects, otherwise it is unused.
Sphere Radius (centerOfGravitySphereRadius)
- name: centerOfGravitySphereRadius, type: Float, default: 1
If center of gravity spheres are displayed then this defines their radius, otherwise it is ignored and insensitive.
Show Longest
- name: showClusterOrientationLine0, type: Bool, default: TRUE
If checked then the cluster extend related to the largest eigenvalue (see
PCLClusterStatistics.clusterEigenValuesandPCLClusterStatistics.clusterOrientedExtents) of each cluster is displayed as a line, otherwise it is not shown.
Show Middle
- name: showClusterOrientationLine1, type: Bool, default: TRUE
If checked then the cluster extend related to the middle eigenvalue (see
PCLClusterStatistics.clusterEigenValuesandPCLClusterStatistics.clusterOrientedExtents) of each cluster is displayed as a line, otherwise it is not shown.
Show Shortest
- name: showClusterOrientationLine2, type: Bool, default: TRUE
If checked then the cluster extend related to the smallest eigenvalue (see
PCLClusterStatistics.clusterEigenValuesandPCLClusterStatistics.clusterOrientedExtents) of each cluster is displayed as a line, otherwise it is not shown.
Color Mapping
- name: mapValueTo, type: Enum, default: MAP_VALUE_TO_RAINBOW
Selects how the sphere for center of gravity, and cluster lines are colored.
Values:
Title |
Name |
Description |
|---|---|---|
Base |
MAP_VALUE_TO_BASE |
The current base color from the Inventor state is used for the cluster objects. |
Color |
MAP_VALUE_TO_COLOR |
The color from |
Rainbow |
MAP_VALUE_TO_RAINBOW |
A color from a rainbow map is used for the cluster objects. The minimum cluster index (which the cluster with most points) is mapped to red, the maximum cluster (the one with least points) is mapped to violet. |