
The software and demo data provided in the Examples section on this page supplement the IEEE Pulse article “Medical Image Analysis: A Visual Approach” by Felix Ritter, Tobias Boskamp, André Homeyer, Hendrik Laue, Michael Schwier, Florian Link, and Heinz-Otto Peitgen.
MeVisLab
MeVisLab 2.2.1 or later is required to experiment with the provided image processing pipelines. MeVisLab is provided free of charge for non-commercial research and development and can be downloaded here:
MeVisLab Download (Mac OS X, Windows, and Linux)
Examples
To run an example, start MeVisLab and load a MeVisLab network file (extension .mlab).
- Segmentation and Visualization of Vascular Structures (Vascular Segmentation)
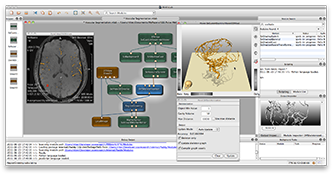
This example illustrates the segmentation of elongated structures, such as vascular systems, and their visualization in 3D. Vascular structures are of high interest, e.g. for the diagnosis of cardiovascular diseases in particular the detection of abnormal variations like aneurysms. In surgery, estimating the risk of injuring the blood supply and drainage of organs is of great importance. - Segmentation, Visualization, and Quantification of Lesions (Lesion Segmentation)
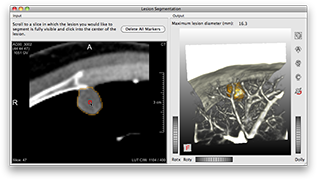
This example segments, quantifies, and visualizes a roundish lesion that is attached to healthy tissue. Here, we would like to calculate the maximum diameter of a metastasis in the human lung that connects to the chest wall but does not yet infiltrate it. The automatic calculation of the maximum diameter in 3D provides a much more reliable indication of shrinkage or growth in follow up examinations than the manual measurement of a diameter in just one cross-sectional image.