TraceView
-
MLModule¶ genre Testauthor MeVis Medical Solutions AGpackage MeVisLab/Standarddll MLDiagnosisdefinition mlDiagnosis.def see also MLLogFile,ErrorTest,Info,CoreControl,ModuleView,RuntimeView,CacheViewkeywords diagnosis,debugging,error,crash,garbage,trash,bad,bug,invalid,test
Purpose
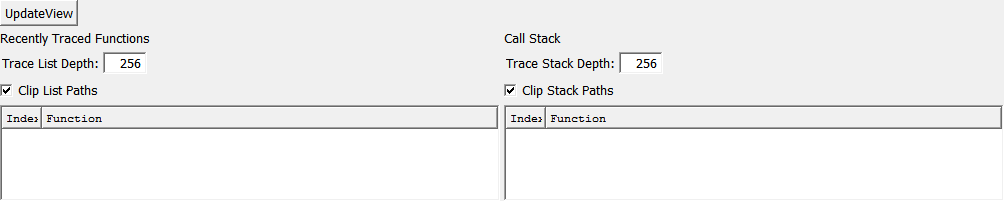
The module TraceView shows the current trace list and stack maintained by the error handler of the ML.
This enables the lastmost-called functions and the current call stack to be analyzed.
Parameter Fields
Field Index
Clip List Paths: Bool |
Clip Stack Paths: Bool |
Trace List: String |
Trace List Depth: Integer |
Trace Stack: String |
Trace Stack Depth: Integer |
UpdateView: Trigger |
Visible Fields
Trace List Depth
-
name:traceListDepth, type:Integer, default:256, minimum:1, maximum:65535¶ Shows the depth of the trace list.
Trace Stack
-
name:traceStack, type:String, persistent:no¶ Shows the call stack of processed functions.
Trace Stack Depth
-
name:traceStackDepth, type:Integer, default:256, minimum:1, maximum:65535¶ Shows the depth of the trace stack.
Clip List Paths
-
name:clipListPathes, type:Bool, default:TRUE¶ If checked, the list of trace paths is clipped which enhances the readability.