MemoryTracer
-
MLModule¶ genre Inspectorsauthor MeVis Medical Solutions AGpackage MeVisLab/Standarddll MLDiagnosisdefinition mlDiagnosis.def see also CoreControl,ModuleView,RuntimeView,CacheView,Checksum,Info,Console,MLLogFilekeywords diagnosis,debugging,logging,tracing,information
Purpose
The module MemoryView is a debugging tool to record and analyze memory usage of the current process. If it is activated it logs all memory allocations and frees and the amount of allocated and freed memory. It also checks whether safety margins around allocated memory blocks are affected, i.e. whether algorithms exceed valid memory borders.
Important Notes
- Note that all memory allocations of the entire process are logged - this includes string operations as well as data structure resizes, window operations, scripting operations and many more. Even simple button presses or mouse movements to (de)activate the memory recording already cause memory operations. Therefore memory logging will nearly always detect asymmetric numbers of allocation/frees and memory sizes. It is up to the user to identify whether these differences are significant or not. See the fields
Maximum Allocation Difference,Maximum Memory Difference, andMin Chunk Size To Logto reduce these effects. - This module is only functional in debug mode on Windows systems. All other systems are not supported.
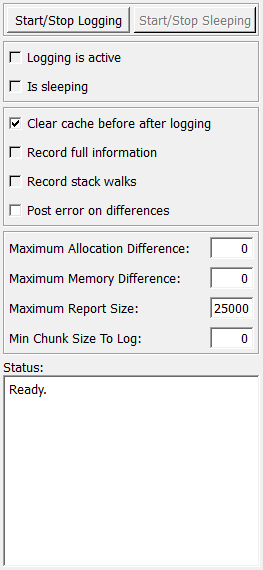
Parameter Fields
Field Index
Clear Cache Before After Logging: Bool |
Post Error On Differences: Bool |
enableAll: Bool |
Record Full Information: Bool |
Is Sleeping: Bool |
Record Stack Walks: Bool |
Logging Is Active: Bool |
Start/Stop Logging: Trigger |
Maximum Allocation Difference: Integer |
Start/Stop Sleeping: Trigger |
Maximum Memory Difference: Integer |
Status: String |
Maximum Report Size: Integer |
|
Min Chunk Size To Log: Integer |
Visible Fields
Logging Is Active
-
name:loggingIsActive, type:Bool, persistent:no¶ Shows whether logging is active.
Is Sleeping
-
name:isSleeping, type:Bool, persistent:no¶ Shows whether logging is temporarily suspended.
Clear Cache Before After Logging
-
name:clearCacheBeforeAfterLogging, type:Bool, default:TRUE¶ If enabled, for each (re)allocation, free and error a table entry is created for a detailed report.
If disabled, only a summary is created. Take care, because recording full information might be time and memory consuming.
Record Full Information
-
name:recordFullInformation, type:Bool, default:FALSE¶ Do not use!
Still deactivated and still unstable experimental functionality.
It adds more information about (potential) memory leaks in reports. It is more significantly more memory and time consuming than normal memory tracing.
Record Stack Walks
-
name:recordStackWalks, type:Bool, default:FALSE¶ Do not use!
Still deactivated and still unstable experimental functionality.
It adds full stack trace information to (potential) memory leaks in reports. It is significantly more memory and time consuming than normal memory tracing.
Post Error On Differences
-
name:postErrorOnDifferences, type:Bool, default:FALSE¶ If enabled, an error is posted to the ML error handled if any memory or allocation difference is exceeded.
Maximum Allocation Difference
-
name:maximumAllocationDifference, type:Integer, default:0¶ Sets the maxmimum allowed limit between allocations and deallocations between logging start and stop.
Maximum Memory Difference
-
name:maximumMemoryDifference, type:Integer, default:0¶ Sets the maxmimum allowed limit between allocated bytes between logging start and stop.
Maximum Report Size
-
name:maximumReportSize, type:Integer, default:25000¶ Sets the maximum allowed size of the generated full report in characters.