| 26.8. Python Debugger | ||
|---|---|---|
 | Chapter 26. MATE |  |
| 26.8. Python Debugger | ||
|---|---|---|
| | Chapter 26. MATE | |
MATE comes with an integrated Python debugger. Its symbols and basic functions resemble those of Visual Studio. Depending on the operating system, the available key commands are taken from Visual Studio (Windows/Linux) and XCode (Mac OS X).
Debugging can be used for .py Python files and for .script files. In case of the latter, only lines with real Python code (i.e. starting with "py: or "*py:) will work as breakpoints.
There are two main ways to open code in the MATE-integrated debugger:
Click the bug button  in MeVisLab to start MATE in a separate process with the debugging enabled, then open a file. The button is part of the Script Debugging toolbar, see Figure 4.30, “View — Toolbars Submenu” for enabling and disabling the toolbar.
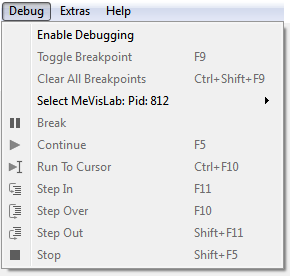
Open a Python or Script file in MATE, then select Debug+Enable Debugging. (If the Debug menu is disabled, MATE is not set up to start as separate process. In this case, change the Preferences setting, see Section 4.3.4, “Preferences — Supportive Programs”.)
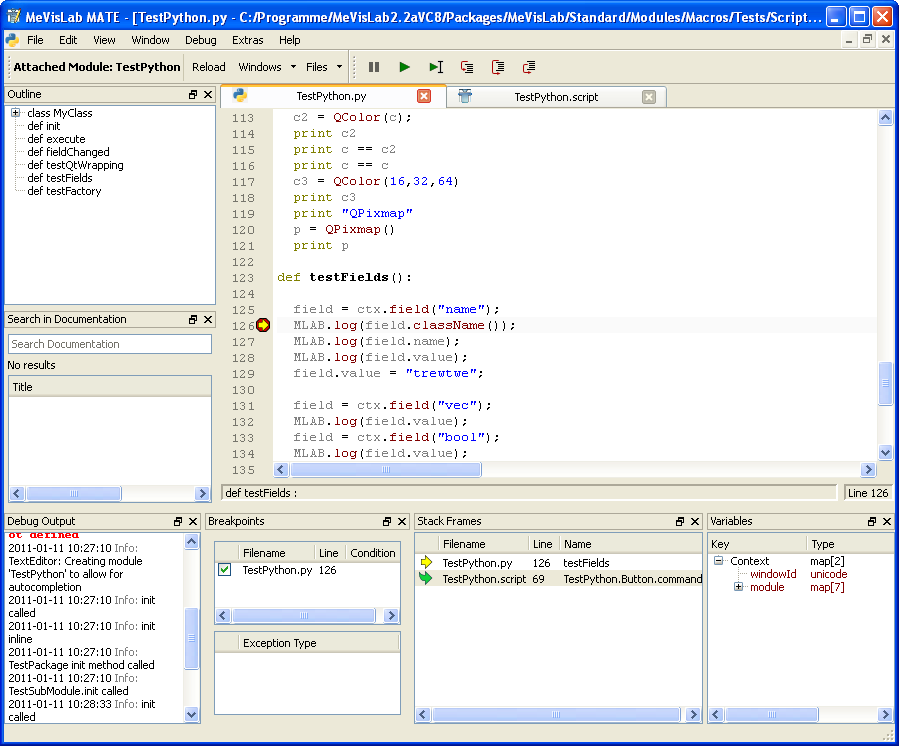
When debugging is enabled, the views Debug Output, Breakpoints, Stack Frames, Variables, and the Debugging toolbar are switched on in standard configuration.
![[Note]](images/note.png) | Note |
|---|---|
Configuration changes made by the user will be saved separately for MATE without debugging and for MATE with debugging enabled. This way, two basic configurations are available. |
Once the debugging is enabled in principle, the actual process needs to get started. For a first test, the module TestPython can be used.
In a line with executable code, click between line number and code to set a breakpoint. A red dot  will be displayed at that position.
Breakpoints offer context menus.
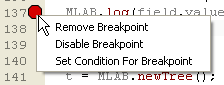
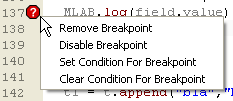
Breakpoints can be set to conditional; this condition can also be removed. Conditions have to be entered in Python syntax, for example: a==12.
In a next step, do something on the module's panel in MeVisLab, e.g., click a button.
| Note |
|---|---|
It is important to remember that the Python scripts in MeVisLab are part of a module or network, and not stand-alone. Therefore, you cannot simply open a script in the MATE debugger and debug it at runtime. What looks like a Start button is actually a Continue button. |
| Note |
|---|---|
During the debugging, MeVisLab is unresponsive! Finish the debugging by letting it run its course before trying to interact with MeVisLab. |
| Note |
|---|---|
The debugger needs an up-to-date |
The script stops at the breakpoint, showing a yellow arrow. The Debug Output is the same as in MeVisLab. In the Breakpoints view a list of all breakpoints can be found, and a context menu is available for editing them. The Stack Frames view shows where the script currently is. In the Variables view, existing variables can be examined.
Click the Continue button  to run to the next breakpoint, or other buttons for other actions.
Table 26.1. Buttons for Debugging
| Button | Description | Explanation |
|---|---|---|
 | Break | Pauses the running function. |
 | Stop | Stops and finishes the running function. |
| Continue | Runs to the next breakpoint or the end of the routine. |
 | Run to cursor | Runs to line where the cursor is placed. |
 | Step In | Step through the code one statement a time. If the statement executes another function, the debugger will step into that function. |
 | Step Over | Step Over is the same as Step In, except that when it reaches a call for another function, it will not step into it. The function will run, and then go to the next statement in the current function. |
 | Step Out | If Step In has been used, Step Out can be used to run the currently called function and return to the function it was called from. |
Table 26.2. Icons for Debugging
| Icon | Description | Explanation |
|---|---|---|
| Breakpoint | Static breakpoint set by user. |
 | Conditional breakpoint | Breakpoint depending on a statement to be true. The condition (in Python syntax) can be set via the context menu of a breakpoint. |
 | Top stack location | Last executed statement. |
 | Current stack location | Displayed via double-clicking the stacks in the Stack Frames view. |
© 2023 MeVis Medical Solutions AG
| |  | |
| 26.7. Preferences |  | 26.9. Module Help Editor |